The competitor summary is designed to give you an overview of the number of matches and prices for each of the competitors you are tracking in the system. It’s a useful report that allows you to track the number of matches and prices and how these metrics have changed over time.
Why it’s useful
It allows you to see the number of matches you have for each of your competitors and how many of their prices are lower than your price.
![]() Click on the number of Lower items to see the detail of the products lower than your price.
Click on the number of Lower items to see the detail of the products lower than your price.
Key Metrics Tracked
Matches – The number of matches to your products
Prices – The number of daily prices captured
Capture PC – The number of prices captured as a % of total matches
Lower – The number of prices that are lower than your price
Lower PC – The number of prices lower than your price as a % of total prices
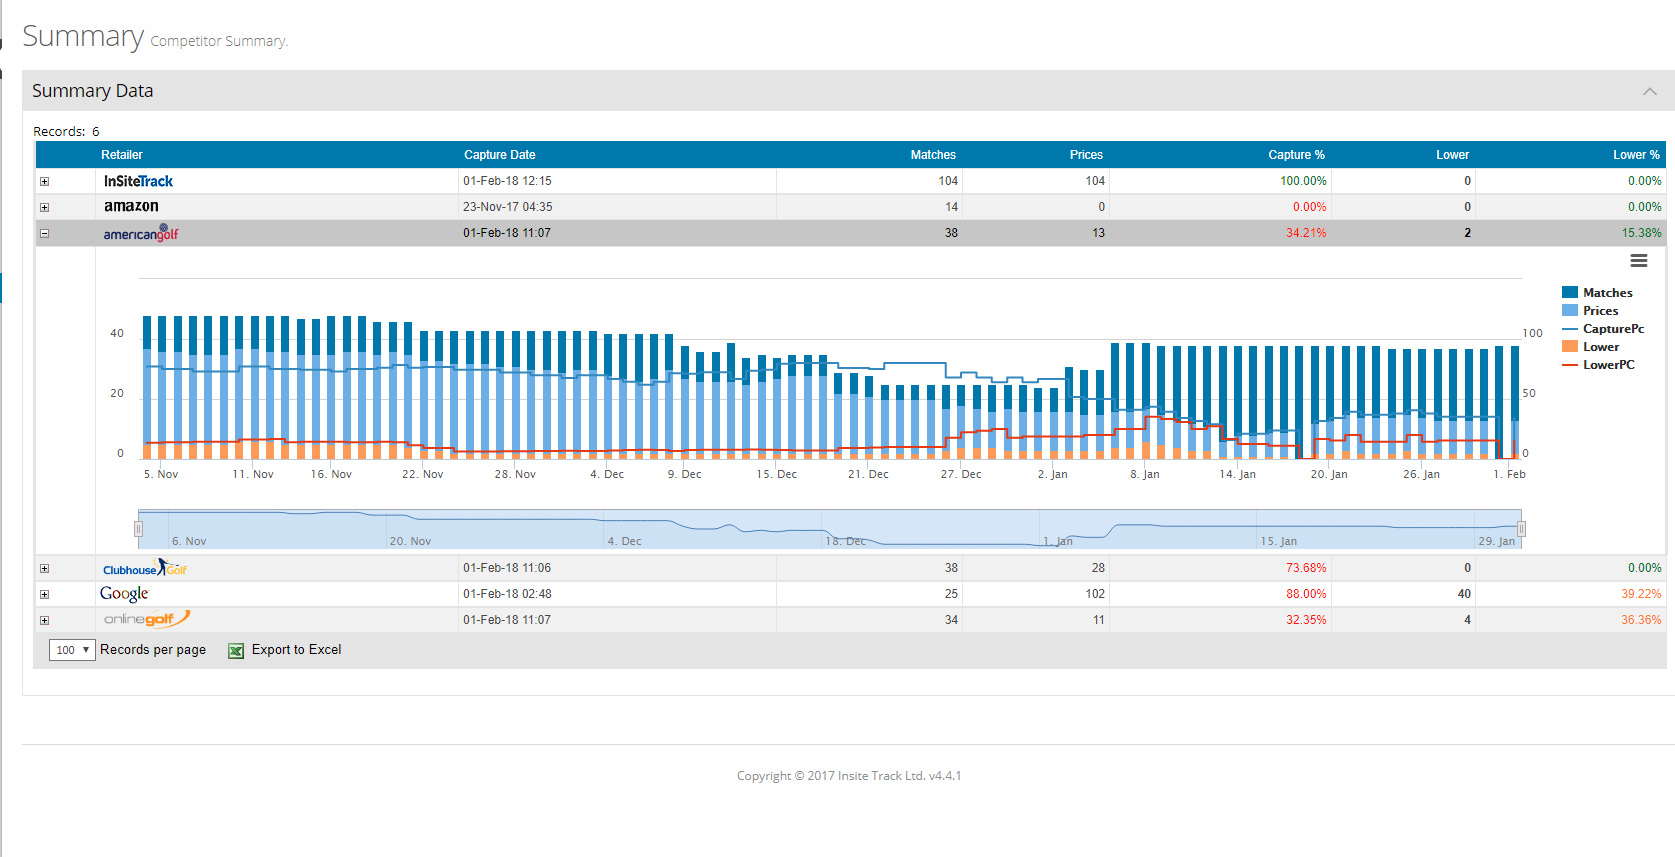
For example, in the screen capture below for American Golf, we have 38 matches, 13 prices (which is 34.21% of the matches), 2 prices are lower which is 15.38% of the total prices.
A note on capture %– this will often be less than 100% as time goes on and as products are discontinued by the retailers you are tracking. Products are typically removed from your competitor sites when this happens and are no longer picked up during the daily price captures. You can see these discontinued products by going to the Edit Matches screen and then set the filter by the retailer and sort by capture date.